


Trading Ebook – Trading Forex
In this,the first of a series of columns, we will introduce to the community of technical analysts a new approach to charting the price history of a stock or commodity. I call this technique the MIDAS method, an acronym for Market Interpretation/Data tahlil System.It is designed to focus attention on the dynamic interplay of support/resistance […]
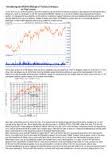

In this,the first of a series of columns, we will introduce to the community of technical analysts a new approach to charting the price history of a stock or commodity. I call this technique the MIDAS method, an acronym for Market Interpretation/Data tahlil System.It is designed to focus attention on the dynamic interplay of support/resistance and accumulation/distribution which are the ultimate determinants of price behavior. Indeed, a Midas chart makes immediately visually apparent an unexpected degree of orderliness in what might otherwise seem to be a random or chaotic process.
برچسبها :
مقالات مرتبط
Cashing In On Short-Term Currency Trends
Currency Trends Trends may be rarer than trading ranges, but that doesn’t mean they can’t be traded. This strategy uses two time frames to identify the trend,an overbought-oversold indicator to pinpoint entry anda trailing stop to protect gains on profitable trades.
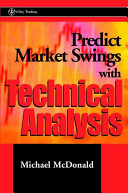
Mcdonald, Micheal – Predict Market Swings With Technical tahlil
Mcdonald A fresh perspective on predicting the market The experience of Wall Street investment manager and analyst Michael \McDonald offers a new perspective on how to navigate the turbulent ups and downs of the markets. His innovative approach to the stock market teaches investors how to use new investment strategies intended to replace the “buy […]
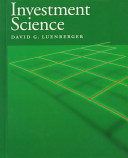
Investment science
Fueled in part by some extraordinary theoretical developments in finance, an explosive growth of information and computing technology, and the global expansion of investment activity, investment theory currently commands a high level of intellectual attention. Recent developments in the fieldare being infused into university classrooms, financial service organizations, business ventures, and into the awareness of […]
آخرین مقالات
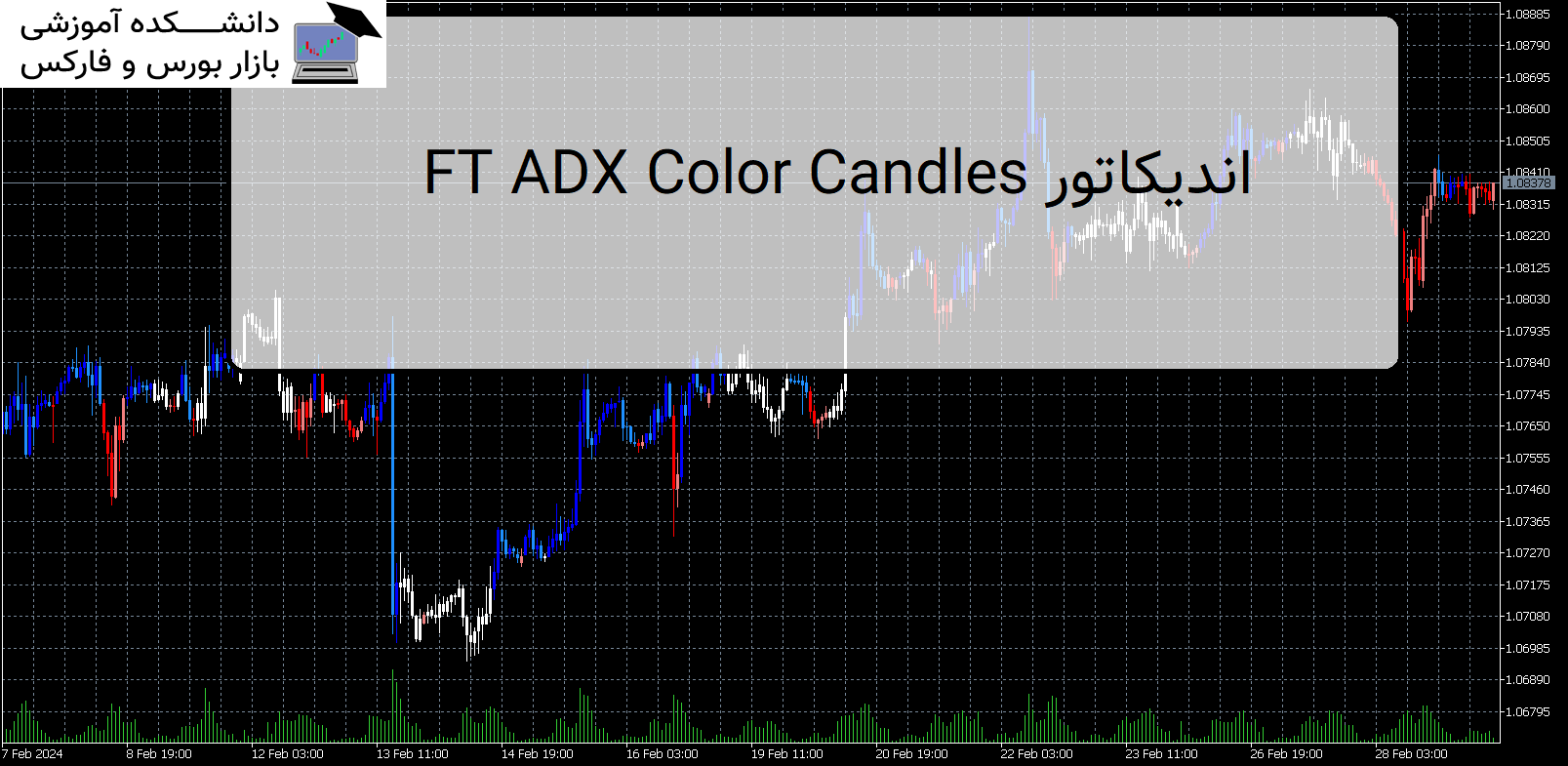
FT ADX Color Candles اندیکاتور MT5
معرفی و دانلود اندیکاتور کاربردی FT ADX Color Candles اندیکاتور کاربردی FT ADX Color Candles زمانی که نیاز دارید به طور همزمان به چندین مورد نگاه کنید، معامله می تواند بسیار خسته کننده باشد. اندیکاتور کاربردی FT ADX Color Candles قالب شمع ها، ساپورت ها، مقاومت ها، برنامه ها، اخبار و اندیکاتورها. هدف این ابزار […]
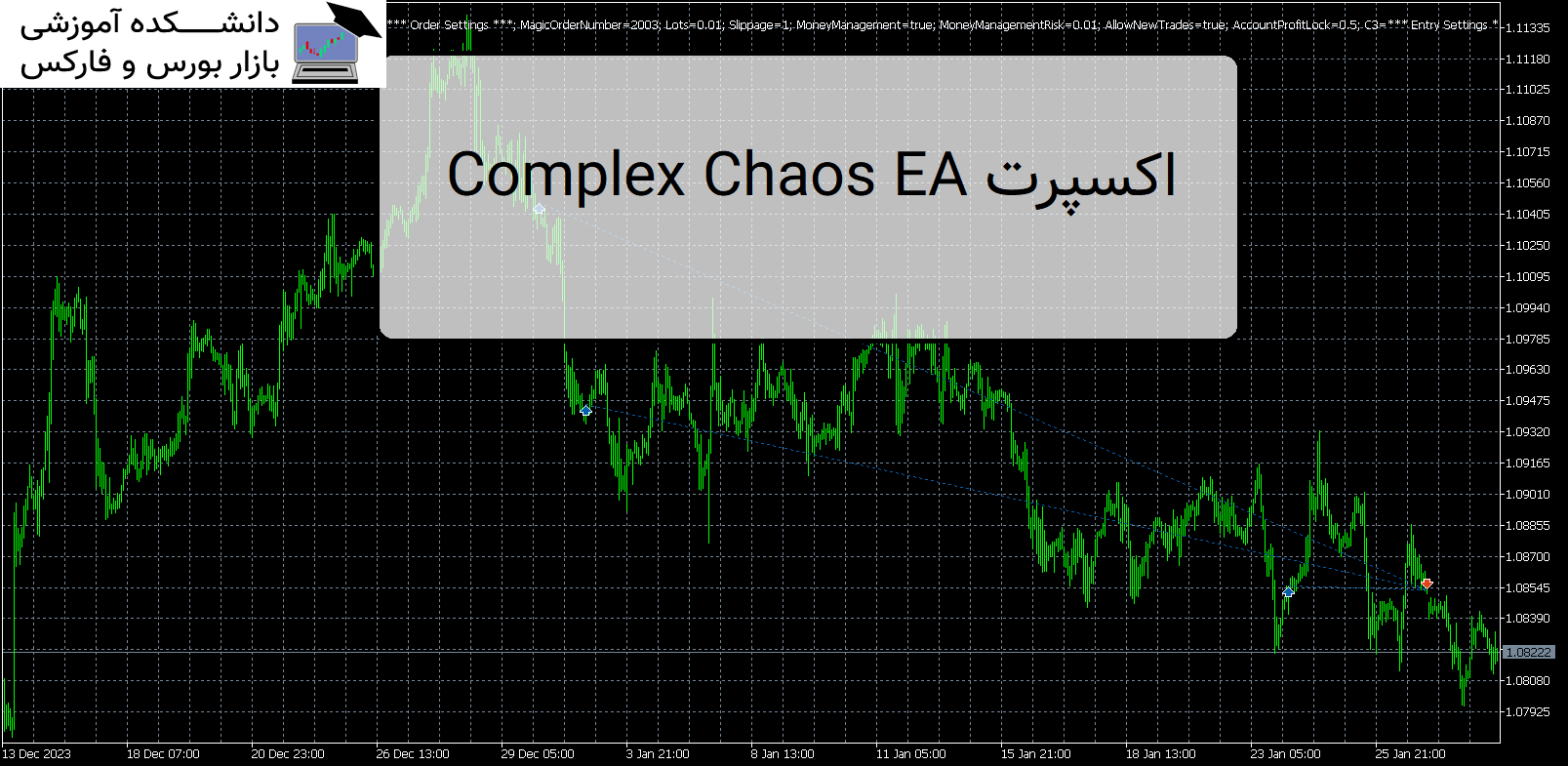
Complex Chaos EA اکسپرت MT5
معرفی و دانلود اکسپرت کاربردی Complex Chaos EA Complex Chaos EA یک سیستم خودکار است که از یک جفت میانگین متحرک نمایی برای تشخیص جهت بازار استفاده می کند و معاملات را در حالت شمع باز باز می کند. معرفی اکسپرت کاربردی Complex Chaos EA اگر بازار بر خلاف یک معامله حرکت کند، در یک […]
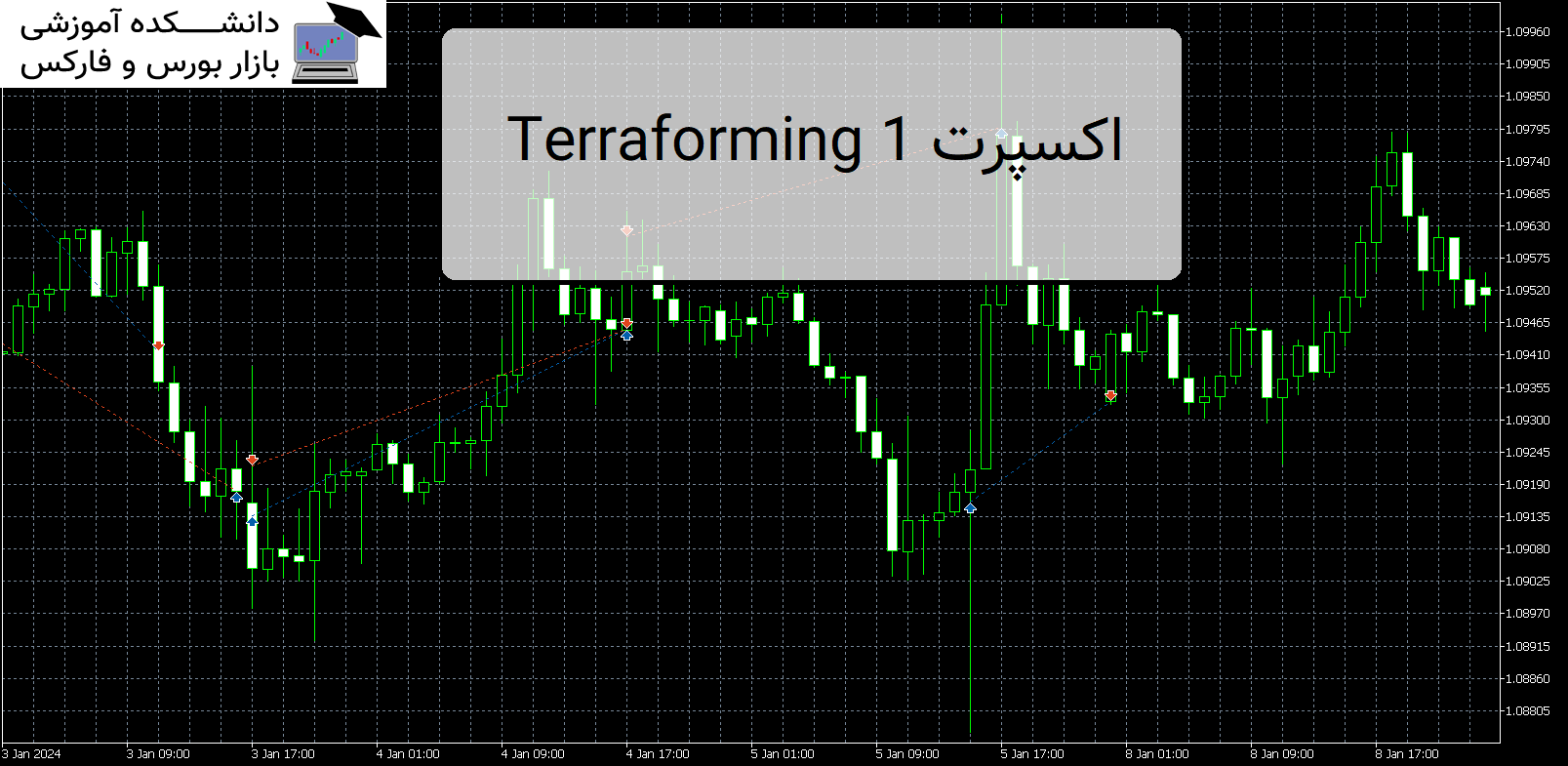
Terraforming 1 اکسپرت MT5
معرفی و دانلود اکسپرت کاربردی Terraforming اولین نسخه من از اکسپرت کاربردی Terraforming 1 . EA از آربیتراژ آماری برای کسب سود از جفت ارز USD EUR و GBP استفاده می کند. معرفی اکسپرت Terraforming 1 موقعیت ها زمانی باز می شوند که یک فرصت آربیتراژ شناسایی شود. پوزیشن ها پس از 3 ساعت یا […]
-
فایل های که پسوند آنها rar یا zip یا 7z هست را چگونه باز کنم؟
توسط نرم افزار Winrar فایل را از حالت فشرده خارج کنید و بعد برای اجرا و یا نصب اقدام کنید. دانلود WINRAR
فایل های با فرمت mq4 و mq5 را چگونه اجرا کنم ؟جهت اجرای این نوع فایل ها برای نسخه mq4 باید متاتریدر 4 را روی سیستم خود و برای نسخه mq5 متاتریدر 5 را روی سیستم عامل خود نصب داشته باشید . جهت راهنمایی کلیک کنید
-
رمز تمامی فایل ها :
- عنوان مقاله : Trading Ebook - Trading Forex
- نوع فایل : PDF
- حجم فایل : 140 کیلوبایت