


Tick
Indicators such as the TICK can reveal the internal strength (or weakness) of the market and highlight intraday turning points.H e r e ’s how one trader combines the TICK with support and resistance tahlil and retracement levels. The TICK is a market breadth indicator that measures the d i ff e rence between the […]

Indicators such as the TICK can reveal the internal strength (or weakness) of the market and highlight intraday turning points.H e r e ’s how one trader combines the TICK with support and resistance tahlil and retracement levels.
The TICK is a market breadth indicator that measures the d i ff e rence between the number of New York Stock Exchange (NYSE) stocks trading on an uptick (i.e., last price higher than the previous price) and the number of stocks trading on a downtick (last price lower than the previous price). For example, if at a given moment 5,200 NYSE stocks were trading up from their previous prices and 4,800 were trading down from their previous prices, the TICK reading would be +400 (5,200- 4,800). The TICK indicator should not be confused with the term “tick,“ which is used to describe a minimum price fluctuation.
برچسبها :
مقالات مرتبط
Management Financial)Gapenski – An Introduction to Accounting and Financial Management)
Management Financial Introductory textbook gives the fundamental concepts of healthcare finance for financial management and accounting. Edition includes the Sarbanes-Oxley Act, impact of cost structure on risk, a revised approach to tahlil, and data on the revenue cycle. Offers key concept summaries, learning objectives, self-test questions, and more. Previous edition: c2003. Management Financial
Maximizing Gains With Trade Management
What in thunder has the editor been doing for the past three months? At first tentatively, then with growing anticipation, and finally with eager excitement, I wound up exploring a whole new realm of trading one that I think you’ll find equally absorbing. Broadly defined, money management is the practice of rating a trade’s prospects […]

50cci-system
Download 50-cci-System : PDF by the link below . . .My good friend Verus has taken an extraordinary amount of time to study and document the essentials of the 50cci trading system that I introduced. I have reviewed and edited this document with Verus and I believe it captures the essentials of the protocol that […]
آخرین مقالات
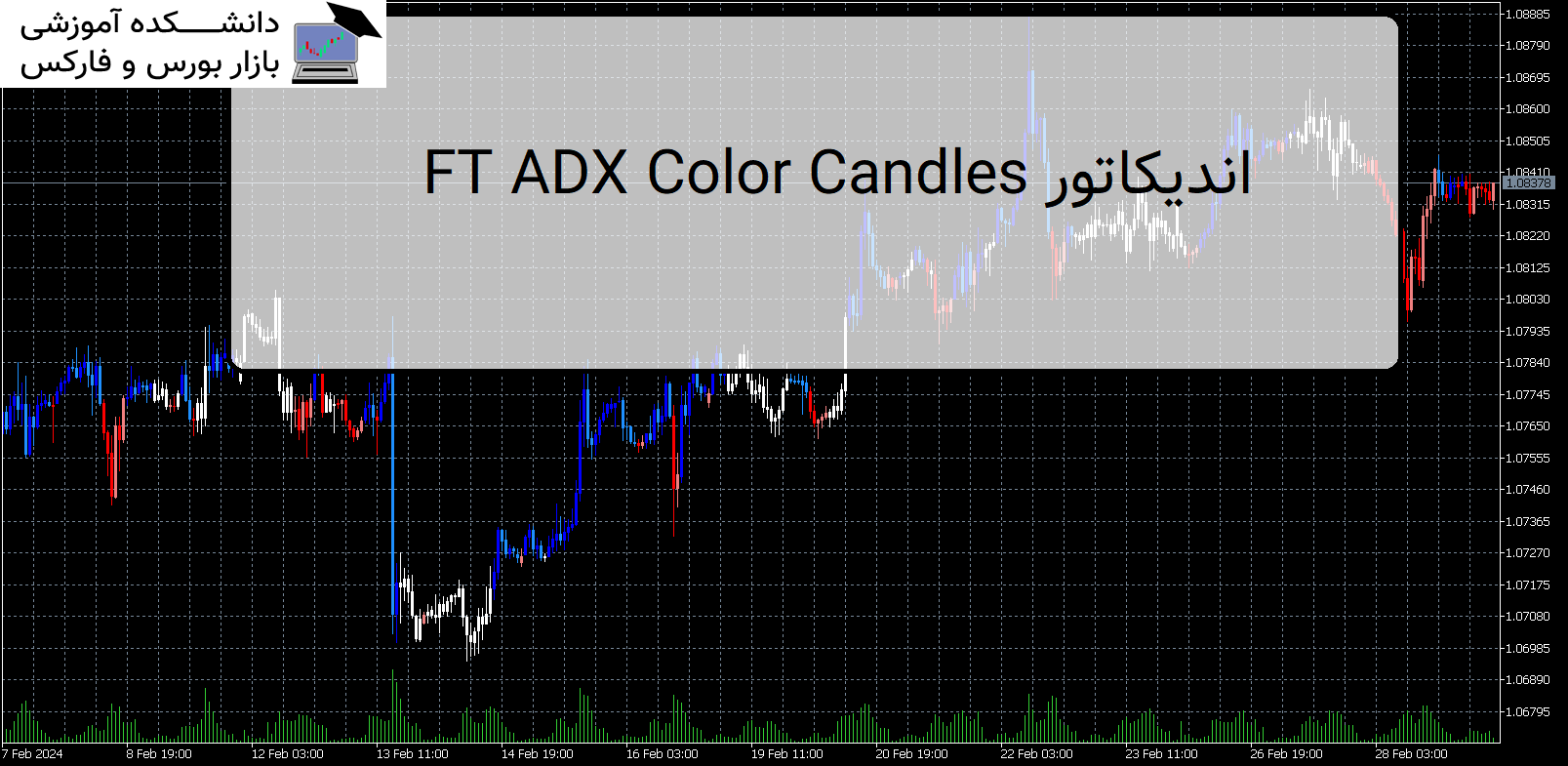
FT ADX Color Candles اندیکاتور MT5
معرفی و دانلود اندیکاتور کاربردی FT ADX Color Candles اندیکاتور کاربردی FT ADX Color Candles زمانی که نیاز دارید به طور همزمان به چندین مورد نگاه کنید، معامله می تواند بسیار خسته کننده باشد. اندیکاتور کاربردی FT ADX Color Candles قالب شمع ها، ساپورت ها، مقاومت ها، برنامه ها، اخبار و اندیکاتورها. هدف این ابزار […]
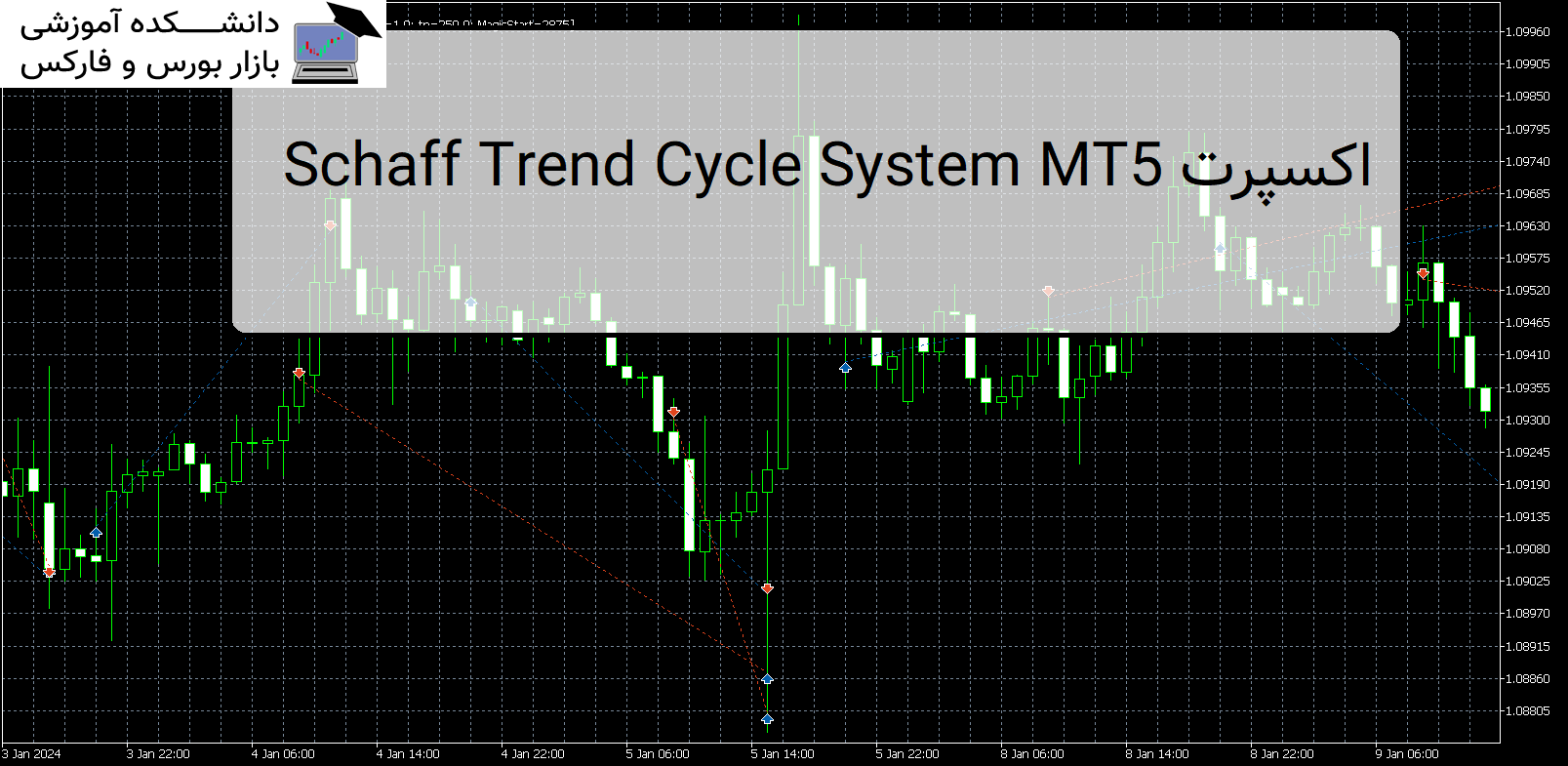
Schaff Trend Cycle System MT5 اکسپرت
معرفی و دانلود اکسپرت کاربردی Schaff Trend Cycle System MT5 اکسپرت کاربردی Schaff Trend Cycle System MT5 که توسط Profectus.AI توسعه یافته است، یک ربات تجاری پیشرفته است که از قدرت سیستم شاف بهره می برد. معرفی اکسپرت کاربردی Schaff Trend Cycle System MT5 این محصول حرفه ای تخصص ما را به نمایش می گذارد […]
TaolishenEN اکسپرت MT5
معرفی و دانلود اکسپرت کاربردی TaolishenEN TaolishenEN تراکنشهای بدون مشارکت EA خطرات زیادی را به همراه دارند. به دلیل ترس یا طمع، بهترین موقعیت معاملاتی را از دست خواهیم داد. معرفی اکسپرت کاربردی TaolishenEN نسخه ی نمایشی تجارت EA: VPS IP: 117.50.106.17 حساب ورود: Taolishen رمز عبور:qq2356692354 با این حال، اگر EA توانایی قضاوت نداشته […]
-
فایل های که پسوند آنها rar یا zip یا 7z هست را چگونه باز کنم؟
توسط نرم افزار Winrar فایل را از حالت فشرده خارج کنید و بعد برای اجرا و یا نصب اقدام کنید. دانلود WINRAR
فایل های با فرمت mq4 و mq5 را چگونه اجرا کنم ؟جهت اجرای این نوع فایل ها برای نسخه mq4 باید متاتریدر 4 را روی سیستم خود و برای نسخه mq5 متاتریدر 5 را روی سیستم عامل خود نصب داشته باشید . جهت راهنمایی کلیک کنید
-
رمز تمامی فایل ها :
- عنوان مقاله : Tick
- نوع فایل : PDF
- حجم فایل : 150 کیلوبایت