


برچسب: Bollinger
5 / 0
Bollinger Bandit Trading Strategy
Trading Strategy Standard deviation is a number that indicates how much on average each of the values in the distribution deviates from the mean (or center) of the distribution. Bollinger Bands, created by John Bollinger in the 1960s, is an indicator that uses this statistical measure to determine support and resistance levels …..
برچسب: Bollinger
5 / 0
Combining Bollinger Bands & Rsi
Rsi Developed by John Bollinger, Bollinger Bands allows users to compare volatility and relative price levels over a period time. Bollinger Bands are envelopes which surround the price bars on a chart. They are plotted two standard deviations away from a simple moving average. Because standard deviation is a measure of volatility, the bands adjust […]
برچسب: Bollinger
5 / 0
gimmibar
gimmibar The \Gimmee bar comes from one of the oldest formations known to traders, the reversal bar at the end of ris ing or fall ing prices when a market is seen overall to be going sideways. Although there cognition of reversal bars is ancient, using them in combination with Bollinger Bands is not ancient. […]
برچسب: Bollinger
5 / 0
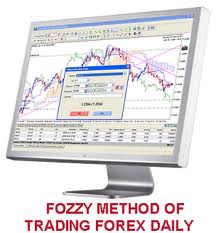
Fozzy Method
Download Fozzy Method: 1. Place an 8 period RSI. Place an 8 period MA of the RSI and Bollinger Bands with a 20 period setting, also on the RSI. 2. When RSI is below the middle Bollinger Band. Go long on the open of the next bar after the MA has crossed above the […]

برچسب: Bollinger
5 / 0
BOLLINGER John A. CFA CMT Market Master
Market Master John Bollinger is a modern-day market master. Unlike many traders who started their working life studying economics or engineering, John graduated with a degree in visual arts, majoring in cinematography. He later moved into the field of market tahlil and was one of the pioneers of technical tahlil using a computer, after buying […]

برچسب: Bollinger
5 / 0
Bollinger John – Bollinger Bands
Trading bands, which are lines plotted in and around the price structure to form an envelope, are the action of prices near the edges of the envelope that we are interested in. It’s not the newest of ideas, but as John Bollinger of Bollinger Capital Management points out, it’s one of the most powerful concepts […]