


Neural Prediction Of Weekly Stock Market Index
The aim of this project is to predict the future values of the Standard & Poor’s 500 (S&P500) stock index based on its past values and the past values of some financial indicators.There have been many attempts at predicting stock market movements,most of them based on statistical time series models. Most of these attempts have […]

The aim of this project is to predict the future values of the Standard & Poor’s 500 (S&P500) stock index based on its past values and the past values of some financial indicators.There have been many attempts at predicting stock market movements,most of them based on statistical time series models. Most of these attempts have been unsuccessful due to the complex dynamics of the stock market.The efficient market hypothesis says that stock prices rapidly adjust to new information by the time the information becomes public knowledge, so that prediction of stock market movements is impossible. This hypothesis seems to be correct for static and linear relationships explored traditionally using multiple regression tahlil. However, it is possible that dynamic and non-linearrelationships exist which cannot be modeled by traditional time series tahlil methods.This, is the motivation for application of neural networks to financial time series tahlil.
برچسبها :
مقالات مرتبط
J R Hill G Pruitt And L Hill – The Ultimate Trading Guide
All speculative markets are governed by the law of supply and demand. Economics have proven that a fair market will determine the equilib-rium point between the supply and demand of goods or services. This equilibrium point is the price where buyers and sellers agree on a value of the product being traded. The price of […]
John Bollinger – Bollinger On Bollinger Band
John Bollinger – Bollinger On Bollinger Band John Bollinger is a giant in today’s trading community. His Bollinger Bands sharpen the sensitivity of fixed indicators, allowing them to more precisely reflect a market’s volatility.
Peaks and Troughs Pring
Troughs Pring The oldest ways of chart tahlil had to work in the days before computers (B.C.). There’s no reason they shouldn’t work now. Here’s a look at peaks and troughs, a classic form of chart tahlil that worked B.C. and work now.
آخرین مقالات
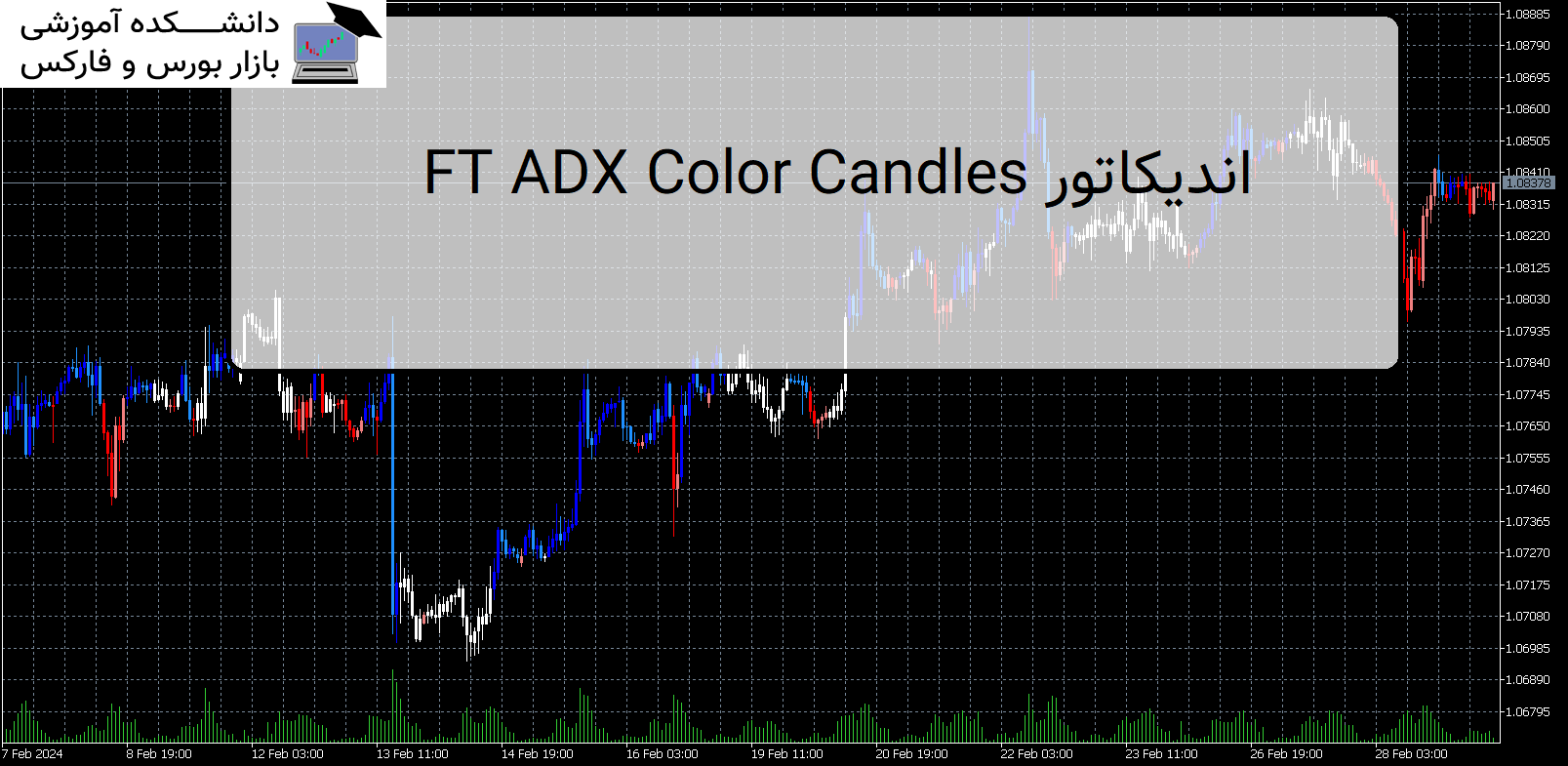
FT ADX Color Candles اندیکاتور MT5
معرفی و دانلود اندیکاتور کاربردی FT ADX Color Candles اندیکاتور کاربردی FT ADX Color Candles زمانی که نیاز دارید به طور همزمان به چندین مورد نگاه کنید، معامله می تواند بسیار خسته کننده باشد. اندیکاتور کاربردی FT ADX Color Candles قالب شمع ها، ساپورت ها، مقاومت ها، برنامه ها، اخبار و اندیکاتورها. هدف این ابزار […]
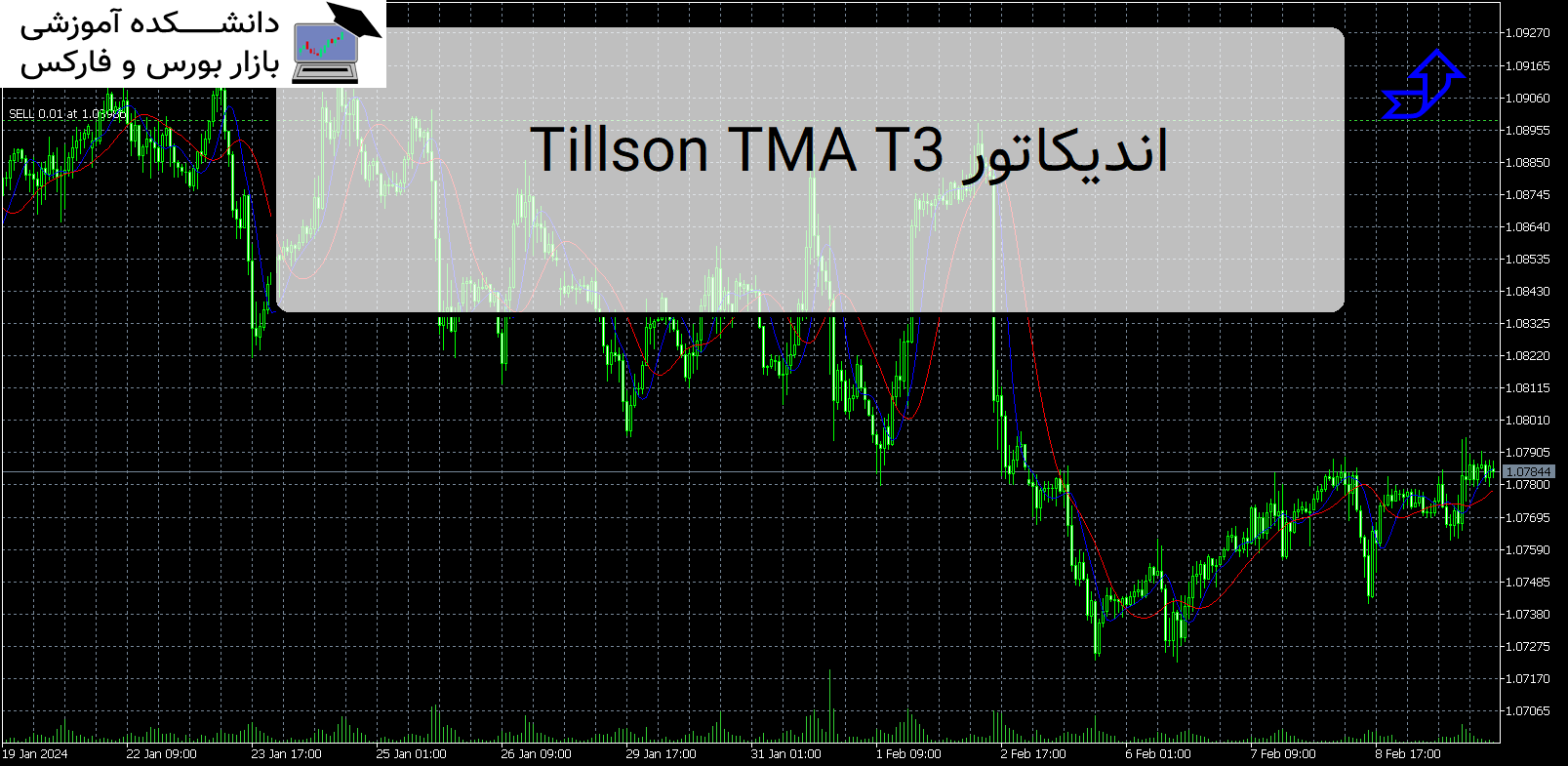
Tillson TMA T3 اندیکاتور MT5
معرفی و دانلود اندیکاتور کاربردی Tillson TMA T3 اندیکاتور کاربردی Tillson TMA T3 این یک میانگین متحرک است که از EMA و DEMA در فرمول خود استفاده می کند و با بسط Binomial درجه 3 محاسبه می شود. معرفی اندیکاتور کاربردی Tillson TMA T3 1- سیگنال های اشتباهی که در سایر میانگین های متحرک (زیگ […]
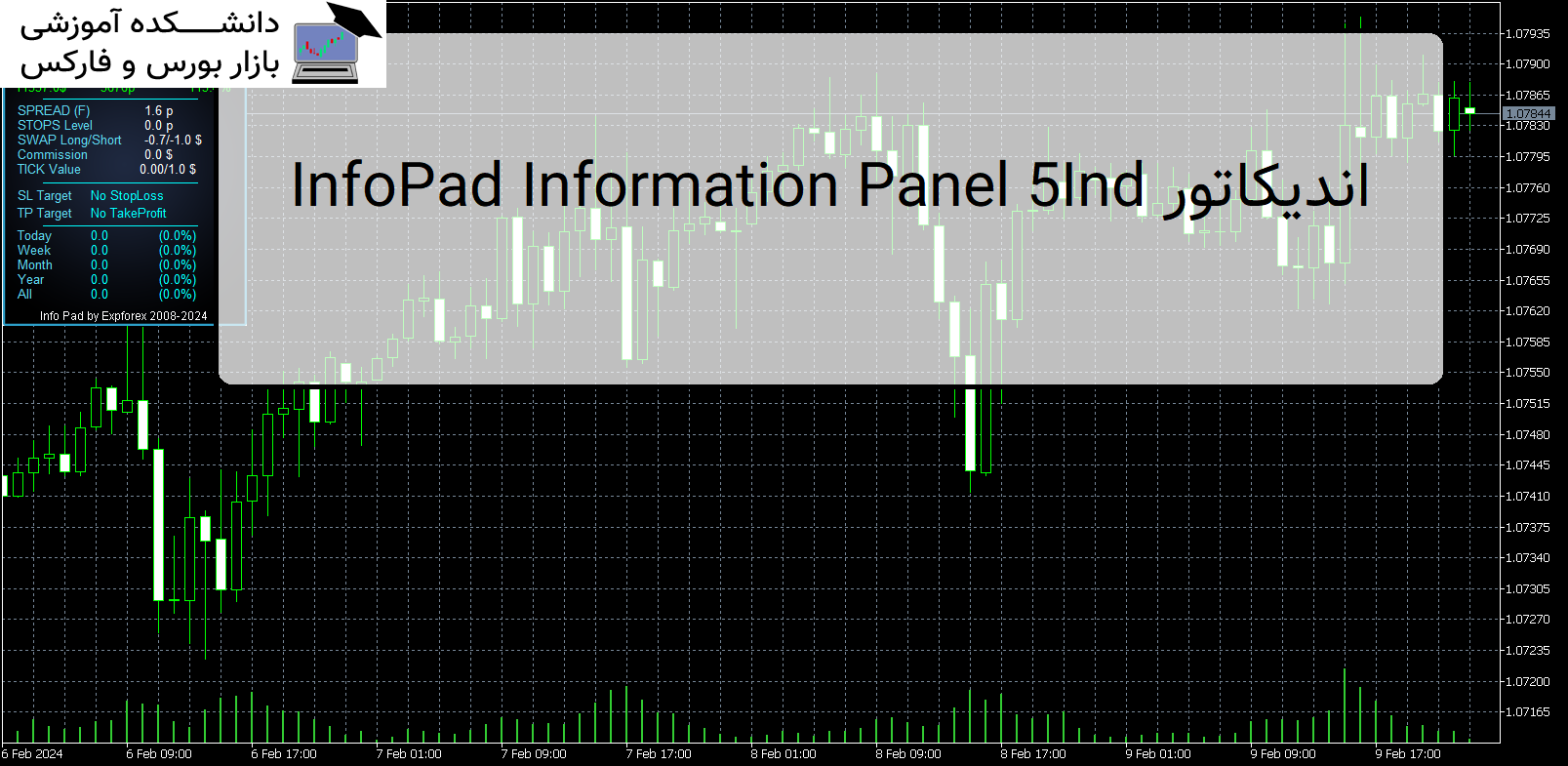
Ind5 InfoPad Information Panel اندیکاتور
معرفی و دانلود اندیکاتور Ind5 InfoPad Information Panel اندیکاتور Ind5 InfoPad Information Panel یک پنل اطلاعاتی است که اطلاعات مربوط به جفت ارز انتخاب شده را در ترمینال MetaTrader 5 ایجاد می کند. معرفی اندیکاتور Ind5 InfoPad Information Panel این نشانگر 5 عملکرد دارد: اطلاعات اصلی و اصلی را در نماد انتخاب شده نشان می […]
-
فایل های که پسوند آنها rar یا zip یا 7z هست را چگونه باز کنم؟
توسط نرم افزار Winrar فایل را از حالت فشرده خارج کنید و بعد برای اجرا و یا نصب اقدام کنید. دانلود WINRAR
فایل های با فرمت mq4 و mq5 را چگونه اجرا کنم ؟جهت اجرای این نوع فایل ها برای نسخه mq4 باید متاتریدر 4 را روی سیستم خود و برای نسخه mq5 متاتریدر 5 را روی سیستم عامل خود نصب داشته باشید . جهت راهنمایی کلیک کنید
-
رمز تمامی فایل ها :
- عنوان مقاله : Neural Prediction Of Weekly Stock Market Index
- نوع فایل : PDF
- حجم فایل : 100 کیلوبایت